Debugging AnimGraphs
The AnimGraph editor has support for debugging graphs, in addition to creating them.
AnimGraph Debug Replay
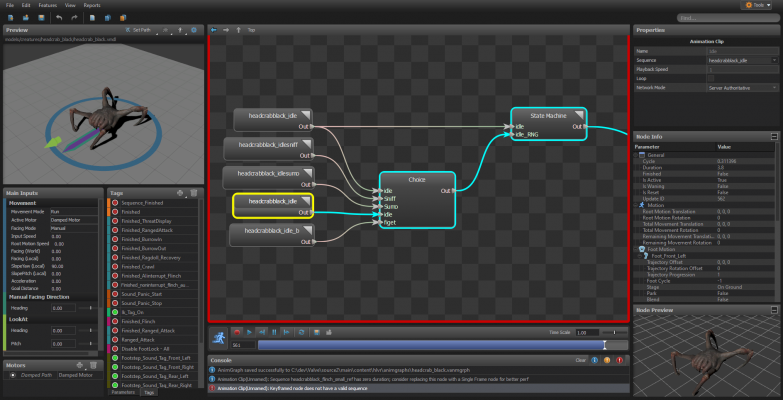
When the AnimGraph Editor is in Preview Mode, it saves a buffer of the last several frames. The bar at the bottom of the timeline control panel will fill up as the buffer fills, and at any time you can click on that timeline bar to see what the state of the graph was at that time.
Replay buffers are a fixed size, so they will not continue to use memory when used for a long time, but that means they only hold that last few seconds of data.
Replay buffers can be saved and loaded in the editor, and they can be recorded from entities during a running game. Note that these buffers are only suitable for debugging and not as a user-facing feature for a game, as tend to be large and they are not guaranteed to still work if the code for the animation graph changes.
To load a recording in the editor, click the Load Replay button (![]() ) on the timeline control panel
) on the timeline control panel
Console Commands
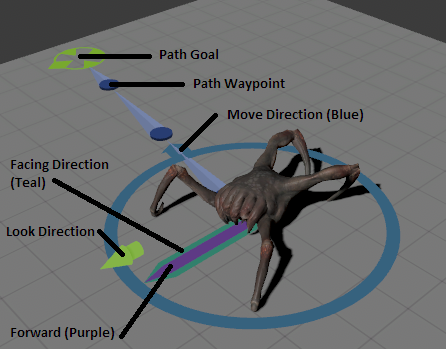
- ent_animgraph_debug, cl_ent_animgraph_debug: Displays the entity's current path and its forward, look, facing, and move directions
- ent_animgraph_record, cl_ent_animgraph_record: Starts recording the animgraph of an entity on the server or client. Parameters can be the entity's ID or its class name. When used without parameters the entity selected is the one at middle of the screen.
- save_animgraph_recording, cl_save_animgraph_recording: Saves all active recordings to disk on the server or client. Files are saved to game\<mod>\SAVE\animgraph with the type of the entity, the date and time.
Visualizing Replay Data
Most of the areas of the graph display some information about their status during replays and in preview mode.
Preview Window
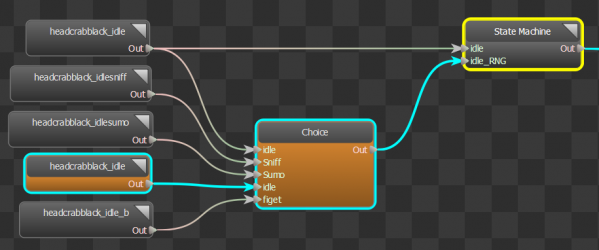
Graph View
The graph view will highlight the active branches of the graph in blue. Nodes will light up orange when they are reset
State Machines
The State Machine Editor will highlight the current state and the transition from its previous state in blue
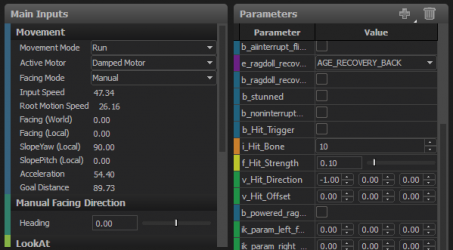
Inputs and Parameters
The values of the main inputs and the parameters will all reflect what their values were at the end of the current frame
Node Info
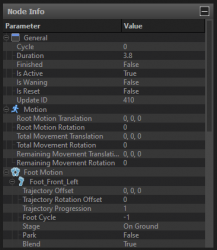
The Properties panel will include detailed information about the status of the selected node, including its cycle, the root motion it is producing, and the status of its foot motion (if configured)
Node Preview
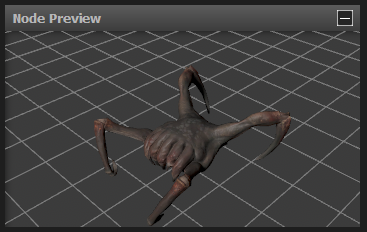
The Properties panel will show a preview of the pose coming from the selected node, before it gets blended or changed by any of its parent. If you are seeing an error in the final animation of your graph, you can click on each node to see what its pose is and quickly identify the source of the problem.
Tags
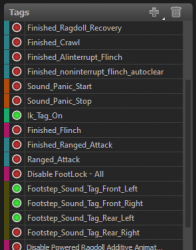
The list of tags will show lights that are green of the the tag is active and green if it isn't
