PerfView
As of 2025, Valve requests that players use PerfView to create an ETW trace for Source 2 games. Event Tracing for Windows (ETW) is a way for modern Windows versions to trace events occurring in both user and kernel-mode drivers and programs. This can be used to investigate anomalies in said software.
The latest version of PerfView can be downloaded from the releases page of the GitHub repository hosted by Microsoft, located here.
When ETW Tracing is Good For Source 2 games:
- Stutters (brief and sudden dip in framerate/increase in frametime)
- Hitches (brief pausing/freezing of the game)
- Net Jitters (you're having the weird "lag" when your internet should be smooth)
When ETW Tracing is NOT Good For Source 2 games:
- Overall lower average framerates (350 fps instead of 400 fps)
- Packet loss
Preparing to Trace
Before running PerfView, the user should run their game in the "plainest" way possible, preventing any interference from third parties. This includes:
This includes, but is not limited to:
- Performance monitoring tools (MSI Afterburner, HWInfo, etc.)
- Productivity applications (Adobe Creative Cloud, Microsoft Office, etc.)
- LED/RGB Applications (Asus Aura, ASRock Polychrome, SignalRGB, etc.)
- Screen recorders (OBS, NVidia ShadowPlay/Share, AMD ReLive, etc.)
- Xbox Game Bar
- Chatting Apps (Discord, Skype, Microsoft Teams, etc.)
If the stutters only appear with a certain program running, then do a trace with said program and document it in the report. This will allow Valve to narrow down the issue further.
- Convars should be set to default
- Launch/command line options should be removed (no autoexec.cfg allowed)
- Settings related to non-graphical performance should be set to default (such as network buffering)
- Keybinds can be kept
- Graphics settings should only be changed from the in-game options; everything else should be set to default
- It is recommended to try tracing multiple times with high graphics, low graphics, DX11, and Vulkan to see if any settings or API has exclusive issues
 Counter-Strike 2 and
  Deadlock exclusive: Telemetry HUD should be turned on, particularly for max frametime and FPS
- Adjusted process priorities/affinities should be removed (such as if done through Task Manager, Process Lasso, etc.)
- Any overclocks should be reverted to default values
- Graphics driver settings should be set to default for both all applications and the Source 2 game you are tracing (can be done by clicking "Restore" on NVidia or "Factory Reset" on AMD)
Updating software
- Update graphics drivers to the latest version, fixes might have happened there
Staying Private:
Because ETW captures activity from all over a user's PC, the user should refrain from running or typing anything private during the period of the trace, such as:
- Passwords
- Financial details (credit card numbers, bank account numbers, etc.)
- Government ID numbers
- Any application that contains sensitive info such as those above (browser tabs, TurboTax, etc.)
Setting Up PerfView
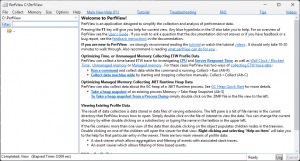
- Run PerfView.exe
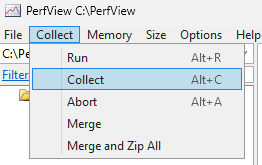
- Select the menu option "Collect", then click "Collect" again
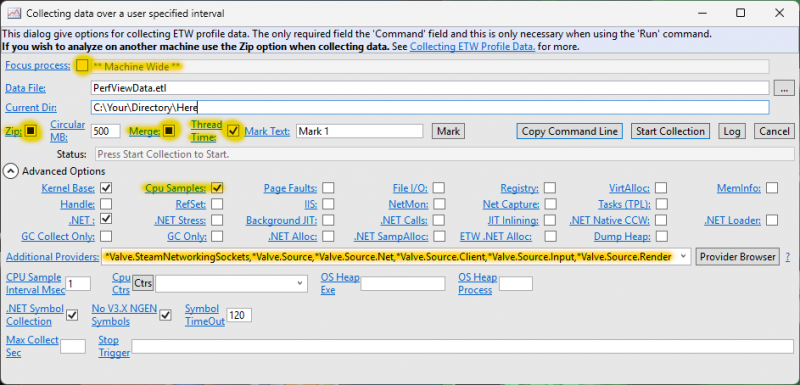
- Make sure that these specific settings are matched
Step 3's Settings:
- "Focus process" should be disabled; the textbox should say "** Machine Wide **"
- "Zip" should be enabled (Checkmark or black square should have the same effect)
- "Merge" should be enabled
- "Thread Time" should be enabled (this requires manual enabling)
- "Cpu Samples" should be enabled
- The following should be pasted exactly as is to "Additional Providers". There should be no spaces at the start, the end, or the middle:
*Valve.SteamNetworkingSockets,*Valve.Source,*Valve.Source.Net,*Valve.Source.Client,*Valve.Source.Input,*Valve.Source.Render
ETW Tracing
- After making sure that your system is plain, your private info stays private, and PerfView's profiler is set up, run the game
- Load the map first; do not profile the game or any map loading unless the stutters have to do with them
- Once the game is running smoothly in the map, note the typical statistics (particularly the max frametime) in the

 game's telemetry window and click "Start Collection" in PerfView's collect window
 - Continue running the map and PerfView until either the issue occurs or the map is changed/reloaded. If the map is changed/reloaded, then click "Cancel" in PerfView and repeat the previous steps up to this point
- Once the issue occurs (and ends), start a mental stopwatch measured in seconds.

 Note the new telemetry statistics (particularly the max frametime)
 - Click "Stop Collection", and stop your mental stopwatch. Note your final time in seconds from the end of the issue to the end of the trace
- Wait for PerfView to zip up the data. If it asks for an option, click the recommended one
Reporting And Submitting the ETW Trace
- Upload the ETW trace to a secure file sharing site.
- Allow the link to the file to be accessed by anyone (test by opening a private browser window), but keep the link between yourself and the valve employees you will share the trace with.
- Contact a relevant Valve developer, whether through email, Reddit chat message, or Twitter direct message
- Have the subject/first line of your message be "ETW Trace" and the relevant game

 List your noted frametimes before and during the issue
- Describe what the issue felt like. How long was the pause, if any? How many pauses were there, if more than one? How long did this issue last? Did the audio stutter as well?
- Document the amount of time that elapsed from the issue to the end of the trace, as noted by your mental stopwatch
- Confirm that the above information is all that you put in the message
- Send the message
After the employee informs you that they have received the ETW Trace, some time passes, and/or your issue is fixed, delete your upload of the trace.


