Debugging Lua scripts
Jump to navigation
Jump to search

This tutorial needs to be cleaned up to conform to a higher standard of quality.
The content of this tutorial should also be checked to ensure it is user-friendly and easy to follow.
For help, see the VDC Editing Help and Wikipedia cleanup process. Also, remember to check for any notes left by the tagger at this article's talk page.
The content of this tutorial should also be checked to ensure it is user-friendly and easy to follow.
For help, see the VDC Editing Help and Wikipedia cleanup process. Also, remember to check for any notes left by the tagger at this article's talk page.
Overview
The Lua debugger uses Eclipse LDT as the front end.
The debugging setup consists of the following steps
- Install Eclipse LDT
- Set up a new project
- Set up a new debug configuration
- Open the Debug perspective
- Connect LDT to the game
Installing Eclipse LDT
- Download Eclipse LDT from this page: https://eclipse.org/ldt/.
- Unzip into a folder of your choice
- Run LuaDevelopmentTools.exe. Select a workspace folder, which is where LDT stores project information.
Setting up a new LDT project
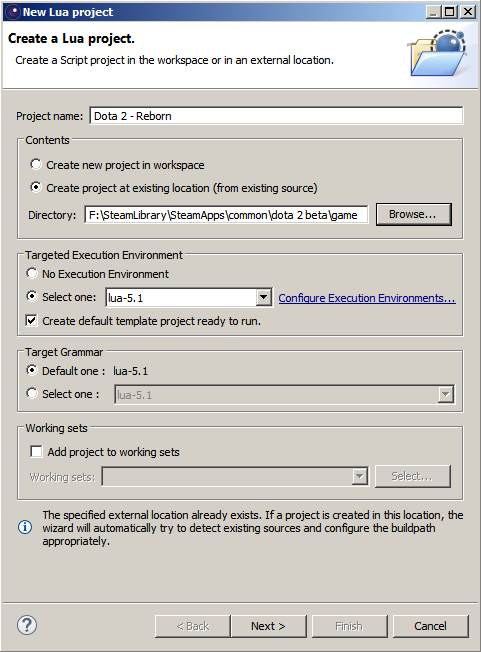
- Click File->New->Lua Project, to bring up the New Lua project dialog
- Select a Project name
- In Contents, select "Create project at existing location...," and set the Directory to the location of the game folder
- Click Next. This may take some time, as LDT scans the contents of the Directory. When the scan is over, ignore the warning that says, "Your project has no source folder defined," and click Finish.
- At this point, it's possible to browse the scripts folder in the Script Explorer view, open Lua files, and set breakpoints by double-clicking in the margin.
Setting up a new LDT debug configuration for the project
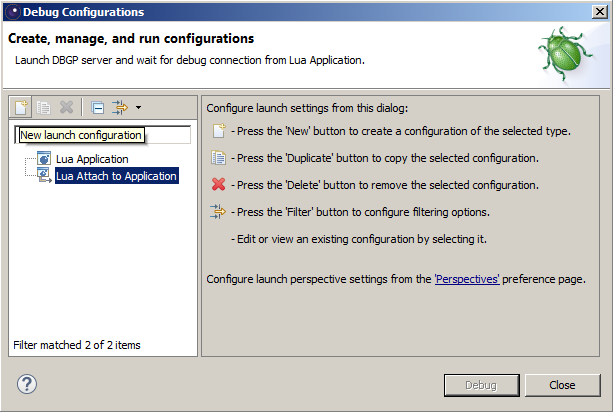
- Click Run->Debug Configurations, to bring up the Debug Configurations dialog
- Select "Lua Attach to Application"
- Click the "New launch configuration" button
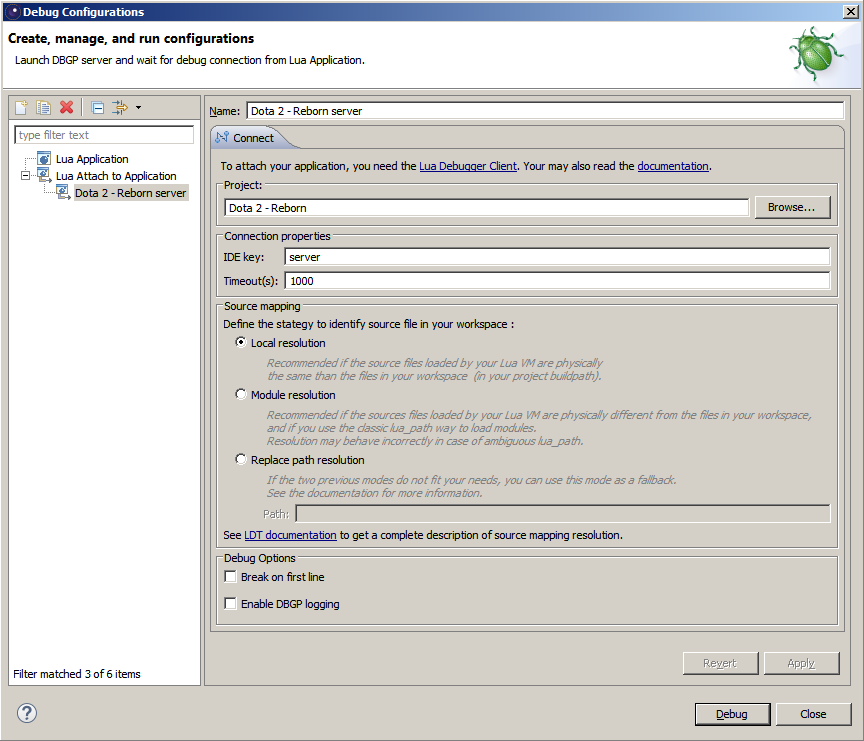
- Give the new configuration a name
- Set the "IDE key" to "server", or "client", to attach to the server or client script VM, respectively
- Set the Timeout(s) to a large value
- Hit "Apply". Close the Debug Configurations dialog.
Opening the Debug Perspective in LDT
Most debugging functionality is actually available via another window on LDT: the Debug perspective. Bring this up by clicking Window->Perspective->Open Perspective->Debug.
Connecting LDT to the game
- Start the game and wait till the frame loop starts. The in-game debugging server only gets to run during the frame loop, and LDT can time-out waiting for a response if this takes too long.
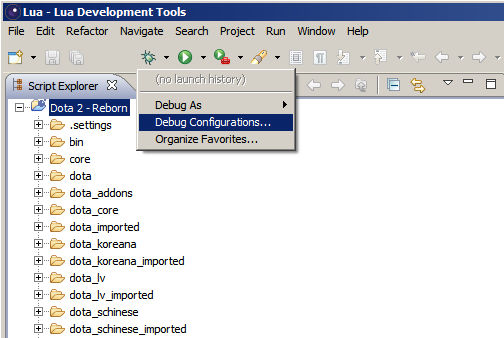
- Click the drop-down arrow next to the bug icon and select Debug Configurations.
- In the Debug Configurations dialog, select the configuration you just created, and hit Debug. Recently used configurations appear in the bug icon drop-down, for quick access.
- In VConsole2, type "script_attach_debugger" to debug the server VM, or "cl_script_attach_debugger" to debug the client VM. Note that for this to work, the Debug Configuration selected must have the IDE key set to "server" and "client" respectively.


