Ru/Dota 2 Workshop Tools/Scripting/Debugging Lua scripts
< Ru | Dota 2 Workshop Tools | Scripting
Jump to navigation
Jump to search
Начало
Отладчик Lua использует сборку Eclipse LDT.
Настройка отладки содержит следующие шаги:
- Установка Eclipse LDT
- Создание и настройка нового проекта
- Настройка новой конфигурации отладчика
- Открытие окна отладки
- Подлкючение отладчика Eclipse LDT к игре
Установка Eclipse LDT
- Скачайте Eclipse LDT со страницы: https://eclipse.org/ldt/.
- Распакуйте содержимое архива в папку.
- Из распакованной папки запустите исполняемый файл LuaDevelopmentTools.exe. Выберете папку для workspace(рабочее пространство), где Eclipse LDT будет хранить информацию о проектах.
Setting up a new LDT project
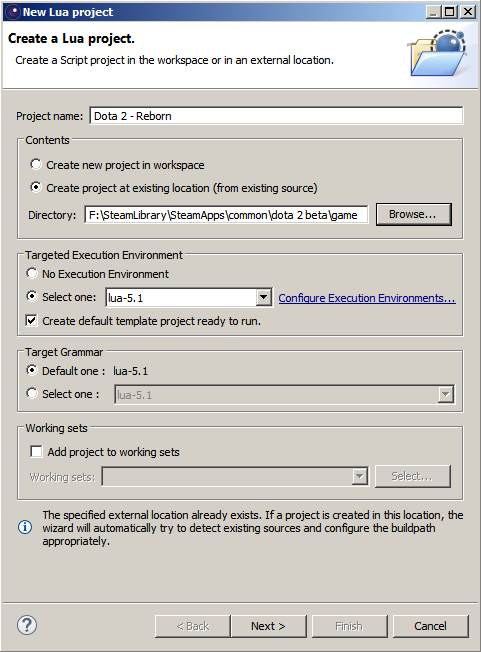
- Click File->New->Lua Project, to bring up the New Lua project dialog
- Select a Project name
- In Contents, select "Create project at existing location...," and set the Directory to the location of the game folder
- Click Next. This may take some time, as LDT scans the contents of the Directory. When the scan is over, ignore the warning that says, "Your project has no source folder defined," and click Finish.
- At this point, it's possible to browse the scripts folder in the Script Explorer view, open Lua files, and set breakpoints by double-clicking in the margin.
Setting up a new LDT debug configuration for the project
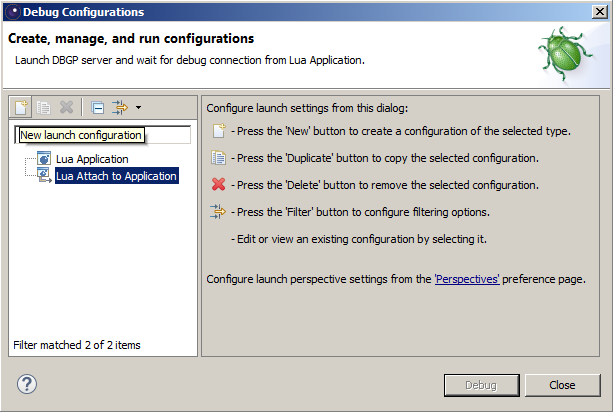
- Click Run->Debug Configurations, to bring up the Debug Configurations dialog
- Select "Lua Attach to Application"
- Click the "New launch configuration" button
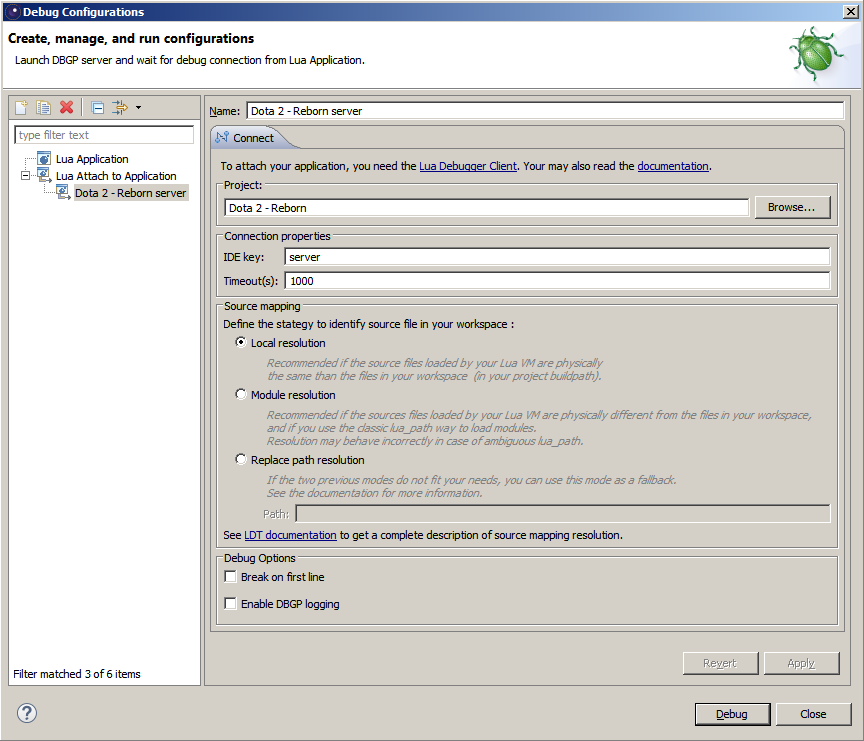
- Give the new configuration a name
- Set the "IDE key" to "server", or "client", to attach to the server or client script VM, respectively
- Set the Timeout(s) to a large value
- Hit "Apply". Close the Debug Configurations dialog.
Opening the Debug Perspective in LDT
Most debugging functionality is actually available via another window on LDT: the Debug perspective. Bring this up by clicking Window->Perspective->Open Perspective->Debug.
Connecting LDT to the game
- Start the game and wait till the frame loop starts. The in-game debugging server only gets to run during the frame loop, and LDT can time-out waiting for a response if this takes too long.
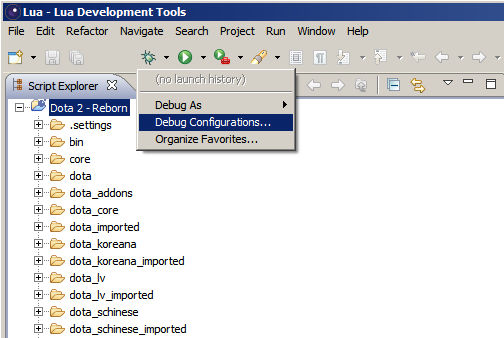
- Click the drop-down arrow next to the bug icon and select Debug Configurations.
- In the Debug Configurations dialog, select the configuration you just created, and hit Debug. Recently used configurations appear in the bug icon drop-down, for quick access.
- In VConsole2, type "script_attach_debugger" to debug the server VM, or "cl_script_attach_debugger" to debug the client VM. Note that for this to work, the Debug Configuration selected must have the IDE key set to "server" and "client" respectively.


