Dota 2 Workshop Tools/Panorama/Debugger: Difference between revisions
No edit summary |
|||
| Line 1: | Line 1: | ||
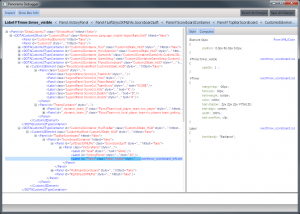
[[File:Panorama debugger.png|thumb|300px|right|caption|Panorama debugging tool]] | [[File:Panorama debugger.png|thumb|300px|right|caption|Panorama debugging tool]] | ||
[[Dota 2 Workshop Tools/Panorama|Panorama]] has a powerful built-in UI debugging tool inspired by web development tool chains. To open the debugger, press F6, move your mouse over a piece of Panorama UI, and click. The debugger window will open with details of the selected UI and its context. (If you can't click on a panel, for example because it is configured with <code>hittest='false'</code> then it is often possible to click a different part of the UI and then manually navigate to the panel in question in the panel hierarchy.) | |||
There are two main parts of the debugger: the panel hierarchy (on the left) and details about the selected panel (on the right). | There are two main parts of the debugger: the panel hierarchy (on the left) and details about the selected panel (on the right). | ||
{{note| | {{note|The Panorama debugger is resource-intensive and will significantly effect game performance while it is open.}} | ||
== Panel Hierarchy == | |||
The panel hierarchy shows a complete tree of all panels currently present in the UI. | |||
== | == Panel Details == | ||
This part of the debugger will show all of the CSS rules that apply to the panel, and which rule is ultimately determining a given property value. '''If you mouse-over any CSS property name, a tooltip will show you detailed information about the property and its legal values.''' | |||
You can also display the final computed values for all panel properties. | |||
{{shortpagetitle}} | |||
[[Category:Panorama]] | [[Category:Panorama]] | ||
[[Category:Dota 2 Workshop Tools]] | [[Category:Dota 2 Workshop Tools]] | ||
Revision as of 23:38, 30 January 2016
Panorama has a powerful built-in UI debugging tool inspired by web development tool chains. To open the debugger, press F6, move your mouse over a piece of Panorama UI, and click. The debugger window will open with details of the selected UI and its context. (If you can't click on a panel, for example because it is configured with hittest='false' then it is often possible to click a different part of the UI and then manually navigate to the panel in question in the panel hierarchy.)
There are two main parts of the debugger: the panel hierarchy (on the left) and details about the selected panel (on the right).
Panel Hierarchy
The panel hierarchy shows a complete tree of all panels currently present in the UI.
Panel Details
This part of the debugger will show all of the CSS rules that apply to the panel, and which rule is ultimately determining a given property value. If you mouse-over any CSS property name, a tooltip will show you detailed information about the property and its legal values.
You can also display the final computed values for all panel properties.
