SteamVR/Frame Timing: Difference between revisions
(Created page with "To display frame timing, right click on vrmonitor, and select Display Frame Timing under Diagnostics. 600px Click 'show in headset' to...") |
Thunder4ik (talk | contribs) |
||
| (13 intermediate revisions by 2 users not shown) | |||
| Line 1: | Line 1: | ||
{{Dead end|date=January 2024}} | |||
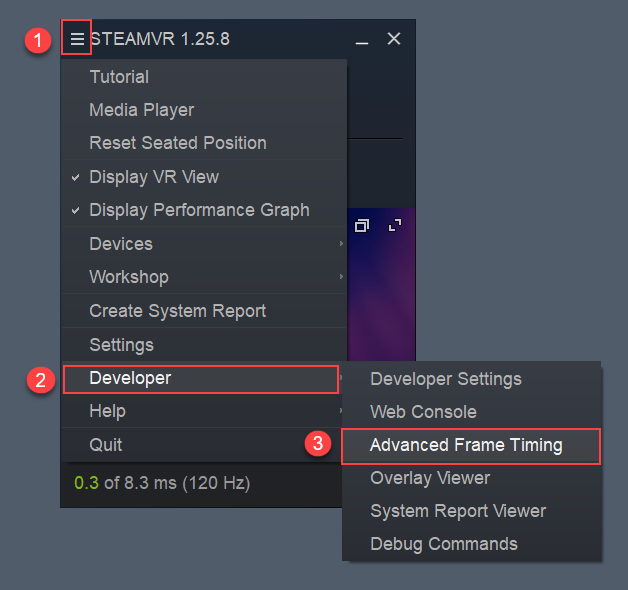
To display the advanced frame timing graph: | |||
# Click the hamburger menu on the SteamVR desktop widget | |||
# Select "Developer" | |||
# Click "Advanced Frame Timing" | |||
[[File:SteamVR Advanced Frame Timing.png]] | |||
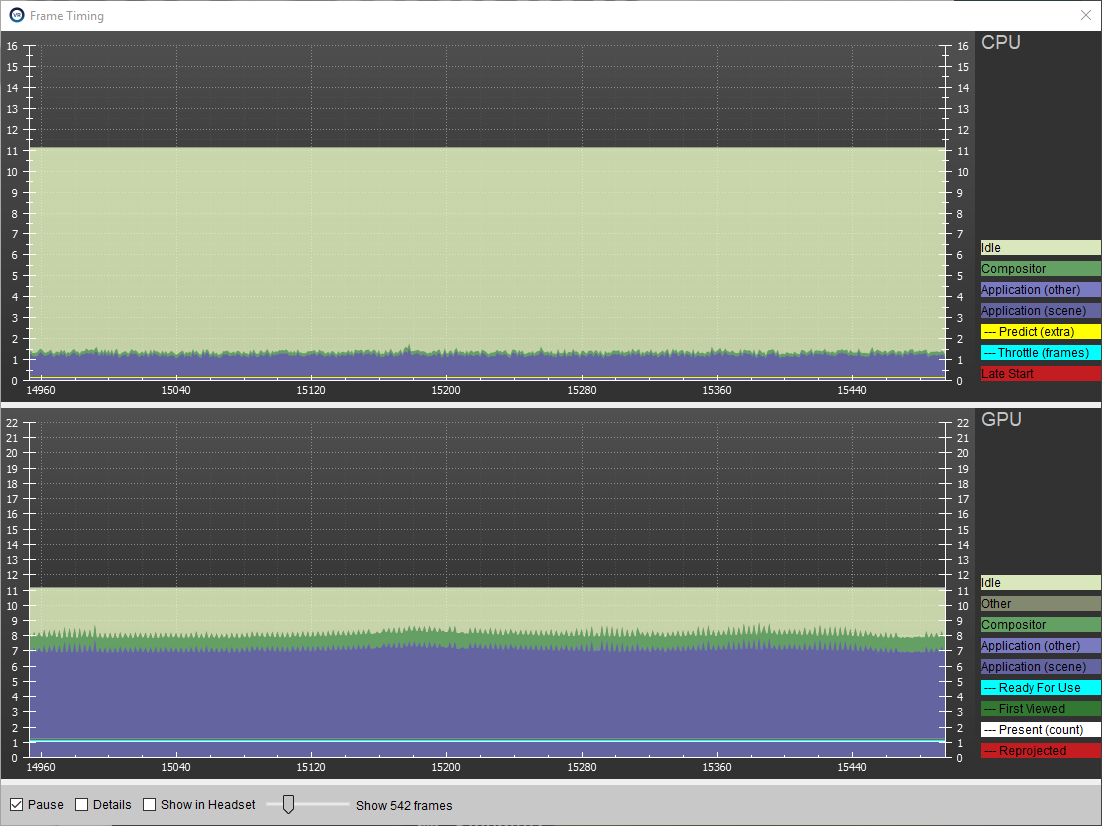
The default view splits out cpu and gpu performance in a pair of stacked graphs: | |||
[[ | [[File:FrameTiming_Stacked2.PNG]] | ||
The blue sections are time spent by the application; these are further split between 'scene' and 'other'. The 'scene' portion is the amount of work performed between when WaitGetPoses returns, and the second eye texture is Submitted (https://github.com/ValveSoftware/openvr/wiki/IVRCompositor_Overview), while 'other' is any time spent after this for rendering the application's companion window, etc. The cpu timing here does not capture any parallel work being performed (e.g. on your application's main thread). The brown 'Other' section in the gpu timing reflects any gpu bubbles, context switching overhead, or gpu work from other application getting scheduled in between other segments of work for that frame. To examine this in more detail requires use of gpuview (https://developer.valvesoftware.com/wiki/SteamVR/Installing_GPUView). | |||
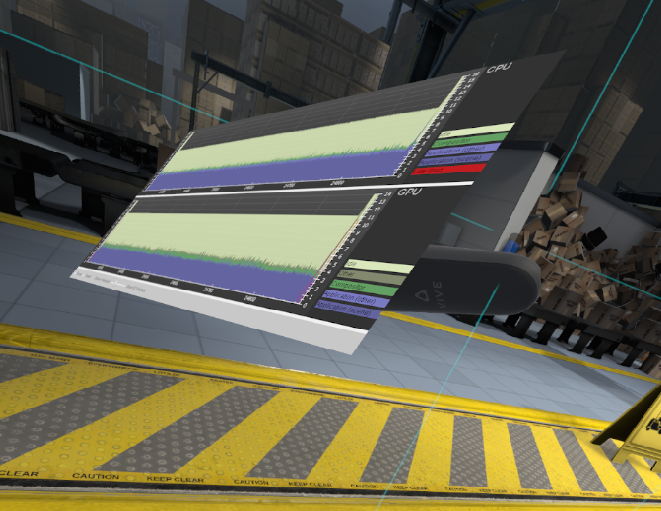
This | Clicking 'Show in Headset' will display this graph in VR as well. This will show up on the back side of your right controller (or at the origin if no controllers are attached). You'll notice the green gpu band take a bit more time when this graph is visible in VR, as rendering Overlays incurs additional work by the compositor. | ||
[[File:FrameTiming_InHeadset.png]] | |||
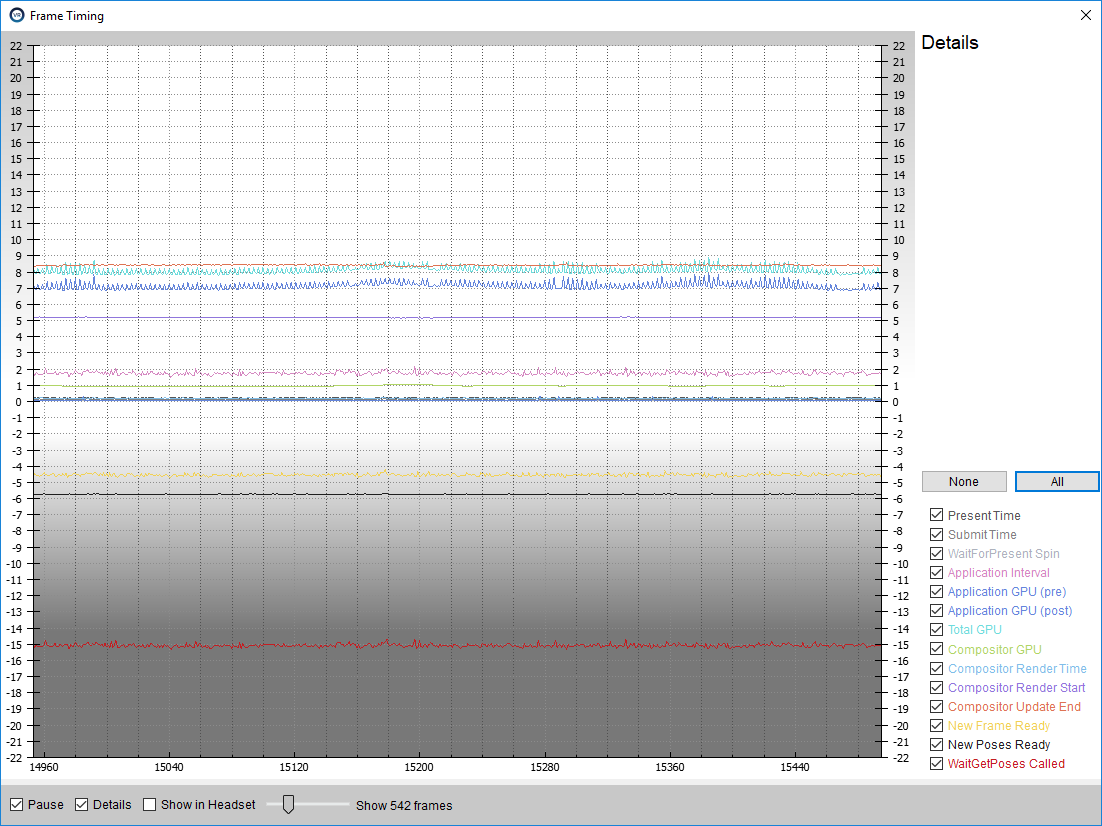
Clicking 'Details' shows a breakdown of all the individual timing being tracked. Use the checkbox next to each label to filter the data. | |||
[[ | [[File:FrameTiming_Details2.PNG]] | ||
This is the same data returned by [https://github.com/ValveSoftware/openvr/wiki/IVRCompositor::GetFrameTiming IVRCompositor.GetFrameTiming]. | |||
<syntaxhighlight lang="cpp"> | |||
/** Provides a single frame's timing information to the app */ | |||
struct Compositor_FrameTiming | |||
{ | |||
uint32_t m_nSize; // Set to sizeof( Compositor_FrameTiming ) | |||
uint32_t m_nFrameIndex; | |||
uint32_t m_nNumFramePresents; // number of times this frame was presented | |||
uint32_t m_nNumMisPresented; // number of times this frame was presented on a vsync other than it was originally predicted to | |||
uint32_t m_nNumDroppedFrames; // number of additional times previous frame was scanned out | |||
uint32_t m_nReprojectionFlags; | |||
/** Absolute time reference for comparing frames. This aligns with the vsync that running start is relative to. */ | |||
double m_flSystemTimeInSeconds; | |||
/** These times may include work from other processes due to OS scheduling. | |||
* The fewer packets of work these are broken up into, the less likely this will happen. | |||
* GPU work can be broken up by calling Flush. This can sometimes be useful to get the GPU started | |||
* processing that work earlier in the frame. */ | |||
float m_flPreSubmitGpuMs; // time spent rendering the scene (gpu work submitted between WaitGetPoses and second Submit) | |||
float m_flPostSubmitGpuMs; // additional time spent rendering by application (e.g. companion window) | |||
float m_flTotalRenderGpuMs; // time between work submitted immediately after present (ideally vsync) until the end of compositor submitted work | |||
float m_flCompositorRenderGpuMs; // time spend performing distortion correction, rendering chaperone, overlays, etc. | |||
float m_flCompositorRenderCpuMs; // time spent on cpu submitting the above work for this frame | |||
float m_flCompositorIdleCpuMs; // time spent waiting for running start (application could have used this much more time) | |||
/** Miscellaneous measured intervals. */ | |||
float m_flClientFrameIntervalMs; // time between calls to WaitGetPoses | |||
float m_flPresentCallCpuMs; // time blocked on call to present (usually 0.0, but can go long) | |||
float m_flWaitForPresentCpuMs; // time spent spin-waiting for frame index to change (not near-zero indicates wait object failure) | |||
float m_flSubmitFrameMs; // time spent in IVRCompositor::Submit (not near-zero indicates driver issue) | |||
/** The following are all relative to this frame's SystemTimeInSeconds */ | |||
float m_flWaitGetPosesCalledMs; | |||
float m_flNewPosesReadyMs; | |||
float m_flNewFrameReadyMs; // second call to IVRCompositor::Submit | |||
float m_flCompositorUpdateStartMs; | |||
float m_flCompositorUpdateEndMs; | |||
float m_flCompositorRenderStartMs; | |||
vr::TrackedDevicePose_t m_HmdPose; // pose used by app to render this frame | |||
uint32_t m_nNumVSyncsReadyForUse; | |||
uint32_t m_nNumVSyncsToFirstView; | |||
}; | |||
</syntaxhighlight> | |||
[[ | The slider allows you to zoom in and out. When zoomed in far enough, the stacked view will change to a bar graph, which is useful for seeing individual frame timings. | ||
[[File:FrameTiming_Bars2.PNG]] | |||
* The yellow line drawn on the CPU graph represents the number of '''''additional''''' vsync intervals ahead the poses provided to the application were predicted in order to accommodate rendering taking more than a single vsync interval to complete. Since these poses are provided to the application before the frame is rendered, this can only be a guess based on prior behavior. Note: A frame will never be displayed before the vsync interval is was predicted to even if it finished rendering in time; this avoids "reverse reprojecting" the frame which can cause judder for animated objects in the scene. | |||
* The cyan line drawn on the CPU graph indicates the throttling level at the time that frame was recorded. Applications which are consistently taking longer than a single vsync interval to deliver frames will eventually be throttled, to smooth out the experience. | |||
* The cyan line drawn on the GPU graph reports the number of vsync intervals before the frame was ready to be used. For an application making framerate, this should hold steady at 1. | |||
* The dark green line drawn on the GPU graph indicates the number of vsync intervals before the frame was actually viewed. A given frame might be ready in time, but since it was predicted out an additional frame, was not necessarily displayed until later. This value can also be zero if the frame was never displayed. This can happen when a newer frame finished in time (e.g. when prediction level drops). | |||
* The white line drawn on the GPU graph shows the number of times a given frame was presented. A frame can only be predicted to a specific point in time, so any additional uses will utilize reprojection to accommodate changes in head pose. This value can be zero if the frame was never displayed. This can happen when the frame did not finish in time, but the next frame did. | |||
* The red line drawn on the GPU graph shows the number of times a given frame was mis-presented (i.e. it was presented on a vsync interval other than it was predicted to). This indicates that it had reprojection applied in order to display at a different time than it was originally intended for. | |||
'Late Start' is a special case where the application has exceeded its cpu budget for the frame, but has not yet dropped a frame due to this. This extra wiggle room comes from what we call 'running start'; it provides a 3ms buffer before the frame starts (i.e. vsync), for the application to begin feeding the gpu render commands for that frame. | |||
More on this here: http://www.gdcvault.com/play/1021771/Advanced-VR. | |||
In this example, you can see at frame 7964 the application did not hand off to the compositor until very near the end of the frame. This ate into its 'running start' time for the next frame, indicated by the red 'Late Start'. You can also see how this affects the gpu by introducing a bubble (idle time) indicated by the brownish 'Other' growing correspondingly. Here also, we see that because we've gotten so close to dropping frames by frame 7966, interleaved reprojection kicks in. The yellow idle time also jumps up (and off the top of the scale) indicating the application now has twice the budget to work with, and after three additional frames under budget, drops back to normal. This whole process repeats itself again about 60 frames later in this example. | |||
[[File:FrameTiming_LateStart.PNG]] | |||
Switching over to details view, we can see that something happened in the application to cause it to call WaitGetPoses much later than normal in these two cases. At this point, you would need to dig into your application's profiler to determine the cause of that. | |||
[[File:FrameTiming_LateStartDetails.PNG]] | |||
If you see something that doesn't make sense, post about it on the [http://steamcommunity.com/app/358720/discussions/0/ forums]. | If you see something that doesn't make sense, post about it on the [http://steamcommunity.com/app/358720/discussions/0/ forums]. | ||
[[Category:SteamVR]] | [[Category:SteamVR]] | ||
Latest revision as of 10:14, 21 January 2024
January 2024
To display the advanced frame timing graph:
- Click the hamburger menu on the SteamVR desktop widget
- Select "Developer"
- Click "Advanced Frame Timing"
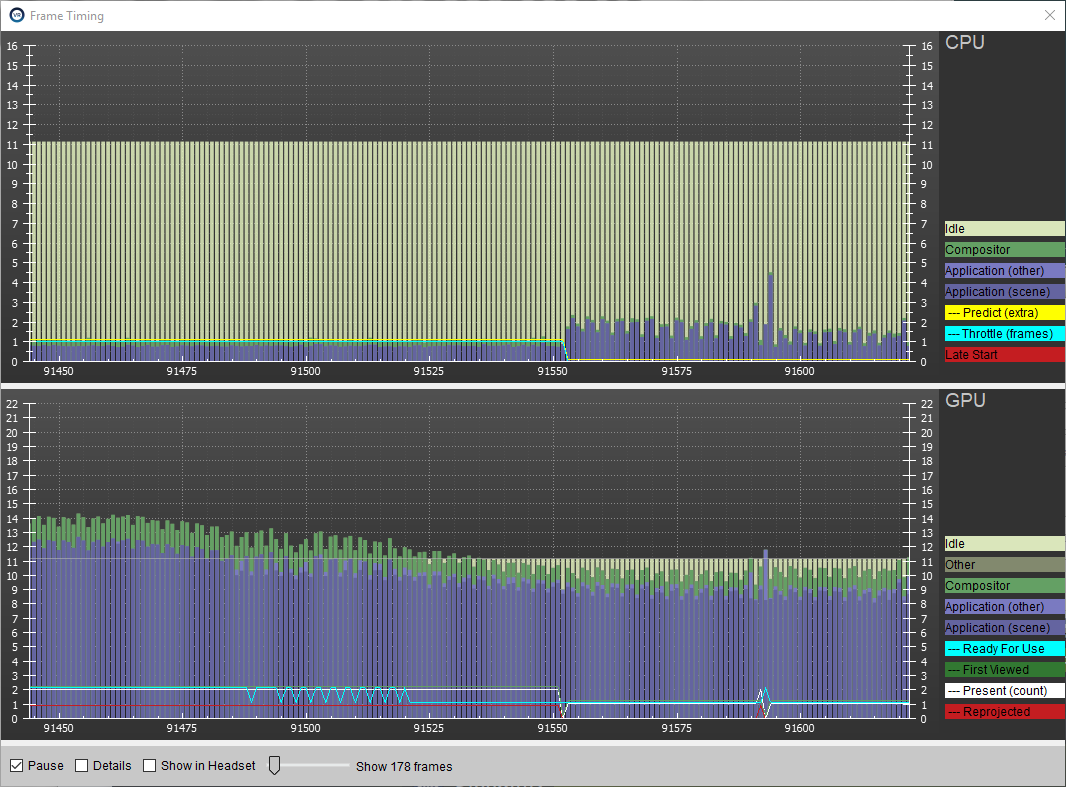
The default view splits out cpu and gpu performance in a pair of stacked graphs:
The blue sections are time spent by the application; these are further split between 'scene' and 'other'. The 'scene' portion is the amount of work performed between when WaitGetPoses returns, and the second eye texture is Submitted (https://github.com/ValveSoftware/openvr/wiki/IVRCompositor_Overview), while 'other' is any time spent after this for rendering the application's companion window, etc. The cpu timing here does not capture any parallel work being performed (e.g. on your application's main thread). The brown 'Other' section in the gpu timing reflects any gpu bubbles, context switching overhead, or gpu work from other application getting scheduled in between other segments of work for that frame. To examine this in more detail requires use of gpuview (https://developer.valvesoftware.com/wiki/SteamVR/Installing_GPUView).
Clicking 'Show in Headset' will display this graph in VR as well. This will show up on the back side of your right controller (or at the origin if no controllers are attached). You'll notice the green gpu band take a bit more time when this graph is visible in VR, as rendering Overlays incurs additional work by the compositor.
Clicking 'Details' shows a breakdown of all the individual timing being tracked. Use the checkbox next to each label to filter the data.
This is the same data returned by IVRCompositor.GetFrameTiming.
/** Provides a single frame's timing information to the app */
struct Compositor_FrameTiming
{
	uint32_t m_nSize; // Set to sizeof( Compositor_FrameTiming )
	uint32_t m_nFrameIndex;
	uint32_t m_nNumFramePresents; // number of times this frame was presented
	uint32_t m_nNumMisPresented; // number of times this frame was presented on a vsync other than it was originally predicted to
	uint32_t m_nNumDroppedFrames; // number of additional times previous frame was scanned out
	uint32_t m_nReprojectionFlags;

	/** Absolute time reference for comparing frames.  This aligns with the vsync that running start is relative to. */
	double m_flSystemTimeInSeconds;

	/** These times may include work from other processes due to OS scheduling.
	* The fewer packets of work these are broken up into, the less likely this will happen.
	* GPU work can be broken up by calling Flush.  This can sometimes be useful to get the GPU started
	* processing that work earlier in the frame. */
	float m_flPreSubmitGpuMs; // time spent rendering the scene (gpu work submitted between WaitGetPoses and second Submit)
	float m_flPostSubmitGpuMs; // additional time spent rendering by application (e.g. companion window)
	float m_flTotalRenderGpuMs; // time between work submitted immediately after present (ideally vsync) until the end of compositor submitted work
	float m_flCompositorRenderGpuMs; // time spend performing distortion correction, rendering chaperone, overlays, etc.
	float m_flCompositorRenderCpuMs; // time spent on cpu submitting the above work for this frame
	float m_flCompositorIdleCpuMs; // time spent waiting for running start (application could have used this much more time)

	/** Miscellaneous measured intervals. */
	float m_flClientFrameIntervalMs; // time between calls to WaitGetPoses
	float m_flPresentCallCpuMs; // time blocked on call to present (usually 0.0, but can go long)
	float m_flWaitForPresentCpuMs; // time spent spin-waiting for frame index to change (not near-zero indicates wait object failure)
	float m_flSubmitFrameMs; // time spent in IVRCompositor::Submit (not near-zero indicates driver issue)

	/** The following are all relative to this frame's SystemTimeInSeconds */
	float m_flWaitGetPosesCalledMs;
	float m_flNewPosesReadyMs;
	float m_flNewFrameReadyMs; // second call to IVRCompositor::Submit
	float m_flCompositorUpdateStartMs;
	float m_flCompositorUpdateEndMs;
	float m_flCompositorRenderStartMs;

	vr::TrackedDevicePose_t m_HmdPose; // pose used by app to render this frame

	uint32_t m_nNumVSyncsReadyForUse;
	uint32_t m_nNumVSyncsToFirstView;
};
The slider allows you to zoom in and out. When zoomed in far enough, the stacked view will change to a bar graph, which is useful for seeing individual frame timings.
- The yellow line drawn on the CPU graph represents the number of additional vsync intervals ahead the poses provided to the application were predicted in order to accommodate rendering taking more than a single vsync interval to complete. Since these poses are provided to the application before the frame is rendered, this can only be a guess based on prior behavior. Note: A frame will never be displayed before the vsync interval is was predicted to even if it finished rendering in time; this avoids "reverse reprojecting" the frame which can cause judder for animated objects in the scene.
- The cyan line drawn on the CPU graph indicates the throttling level at the time that frame was recorded. Applications which are consistently taking longer than a single vsync interval to deliver frames will eventually be throttled, to smooth out the experience.
- The cyan line drawn on the GPU graph reports the number of vsync intervals before the frame was ready to be used. For an application making framerate, this should hold steady at 1.
- The dark green line drawn on the GPU graph indicates the number of vsync intervals before the frame was actually viewed. A given frame might be ready in time, but since it was predicted out an additional frame, was not necessarily displayed until later. This value can also be zero if the frame was never displayed. This can happen when a newer frame finished in time (e.g. when prediction level drops).
- The white line drawn on the GPU graph shows the number of times a given frame was presented. A frame can only be predicted to a specific point in time, so any additional uses will utilize reprojection to accommodate changes in head pose. This value can be zero if the frame was never displayed. This can happen when the frame did not finish in time, but the next frame did.
- The red line drawn on the GPU graph shows the number of times a given frame was mis-presented (i.e. it was presented on a vsync interval other than it was predicted to). This indicates that it had reprojection applied in order to display at a different time than it was originally intended for.
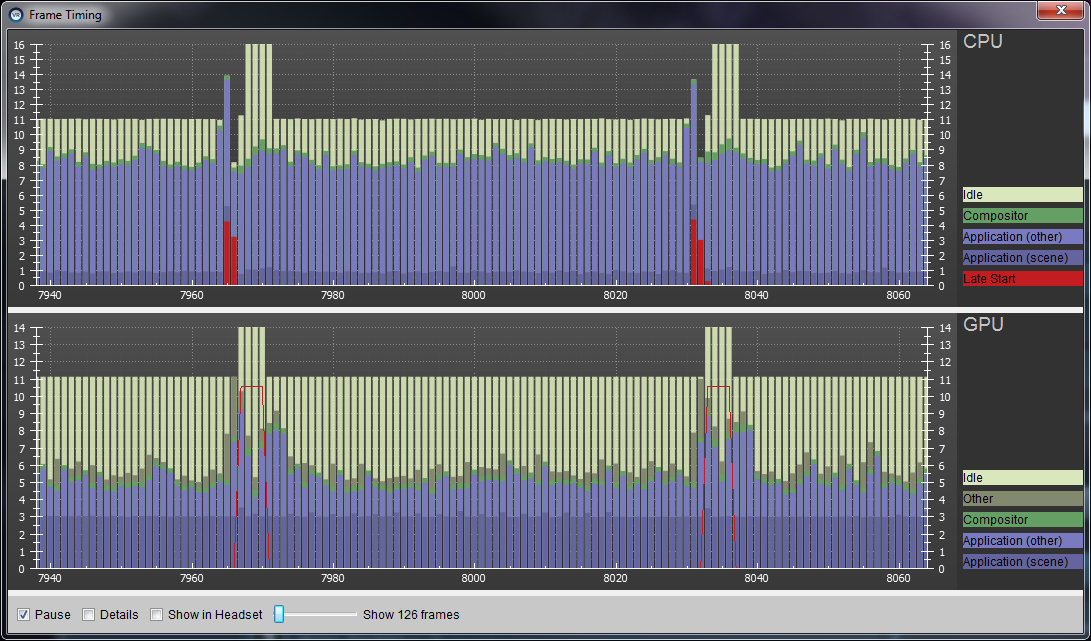
'Late Start' is a special case where the application has exceeded its cpu budget for the frame, but has not yet dropped a frame due to this. This extra wiggle room comes from what we call 'running start'; it provides a 3ms buffer before the frame starts (i.e. vsync), for the application to begin feeding the gpu render commands for that frame.
More on this here: http://www.gdcvault.com/play/1021771/Advanced-VR.
In this example, you can see at frame 7964 the application did not hand off to the compositor until very near the end of the frame. This ate into its 'running start' time for the next frame, indicated by the red 'Late Start'. You can also see how this affects the gpu by introducing a bubble (idle time) indicated by the brownish 'Other' growing correspondingly. Here also, we see that because we've gotten so close to dropping frames by frame 7966, interleaved reprojection kicks in. The yellow idle time also jumps up (and off the top of the scale) indicating the application now has twice the budget to work with, and after three additional frames under budget, drops back to normal. This whole process repeats itself again about 60 frames later in this example.
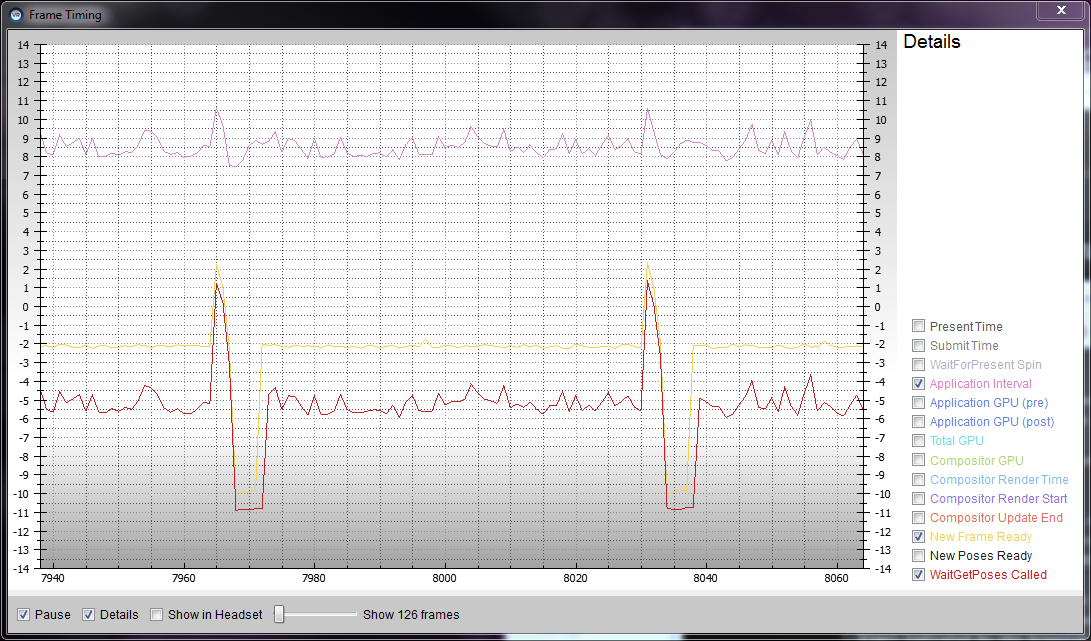
Switching over to details view, we can see that something happened in the application to cause it to call WaitGetPoses much later than normal in these two cases. At this point, you would need to dig into your application's profiler to determine the cause of that.
If you see something that doesn't make sense, post about it on the forums.
